Profiling your Python Applications
Note
The example code referenced on this page can be found in the directory
/shared/eresearch/pbs_job_examples/profiling.
Copy this directory into your own directory.
You might have some Python code that is running a bit slow and you would like to know if there are specific parts of the code that are responsible for its slowness. You might add some timing information to the code like this:
#!/usr/bin/env python3

import time
... some initial code ...

# We need to time this complicated bit of code.
start = time.time()  # Get the start time
... do some
    complicated code ...
end = time.time()    # Get the time now

# Print how long the code took.
print ('Code took %.3d seconds to run' % (end-start) )
and when you run it you get the timing information:
$ ./primes.py
Prime Number Finder
Looking for prime numbers in the range 100000 to 200000 ...
TIME 0.003 seconds, doing preliminary stuff
TIME 134.951 seconds, finding primes
Found 8392 primes during this run.
$
This approach of inserting timing statements throughout your code rapidy becomes a pain when you have lots of functions and several hundred lines or more of code. In fact it’s downright slow and unmanagable. A much better approach is to use the Python profiling tools like Python Call Graph and cProfile.
Using pycallgraph
There are two ways you can use pycallgraph; via the command line or via the pycallgraph module. First install the pycallgraph module in your own python site as below:
$ pip install pycallgraph2
Using the command line is simple:
$ pycallgraph graphviz -- ./primes.py
Alternatively you can call the pycallgraph module from within your code:
from pycallgraph import PyCallGraph
from pycallgraph.output import GraphvizOutput
with PyCallGraph(output=GraphvizOutput()):
    ... do some complicated code ...
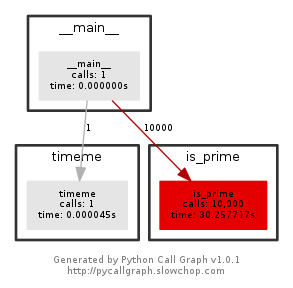
In both cases an image pycallgraph.png will be created. Copy it back to your
local machine to view it. Each function that is entered into will be shown as a box,
with the number of calls to that function and the total time spent in that function.
Functions that took the most time will be coloured red.
Below is the function call graph for the simple primes.py program.
An example of a call graph for a more complex program is here. The code was from a research student and it was running on the eResearch HPC. This clearly shows that just one function is responsible for most of the time that the program takes. Read the documentation for pycallgraph to find out how to specify the output filename and other options like filtering of what functions to profile.
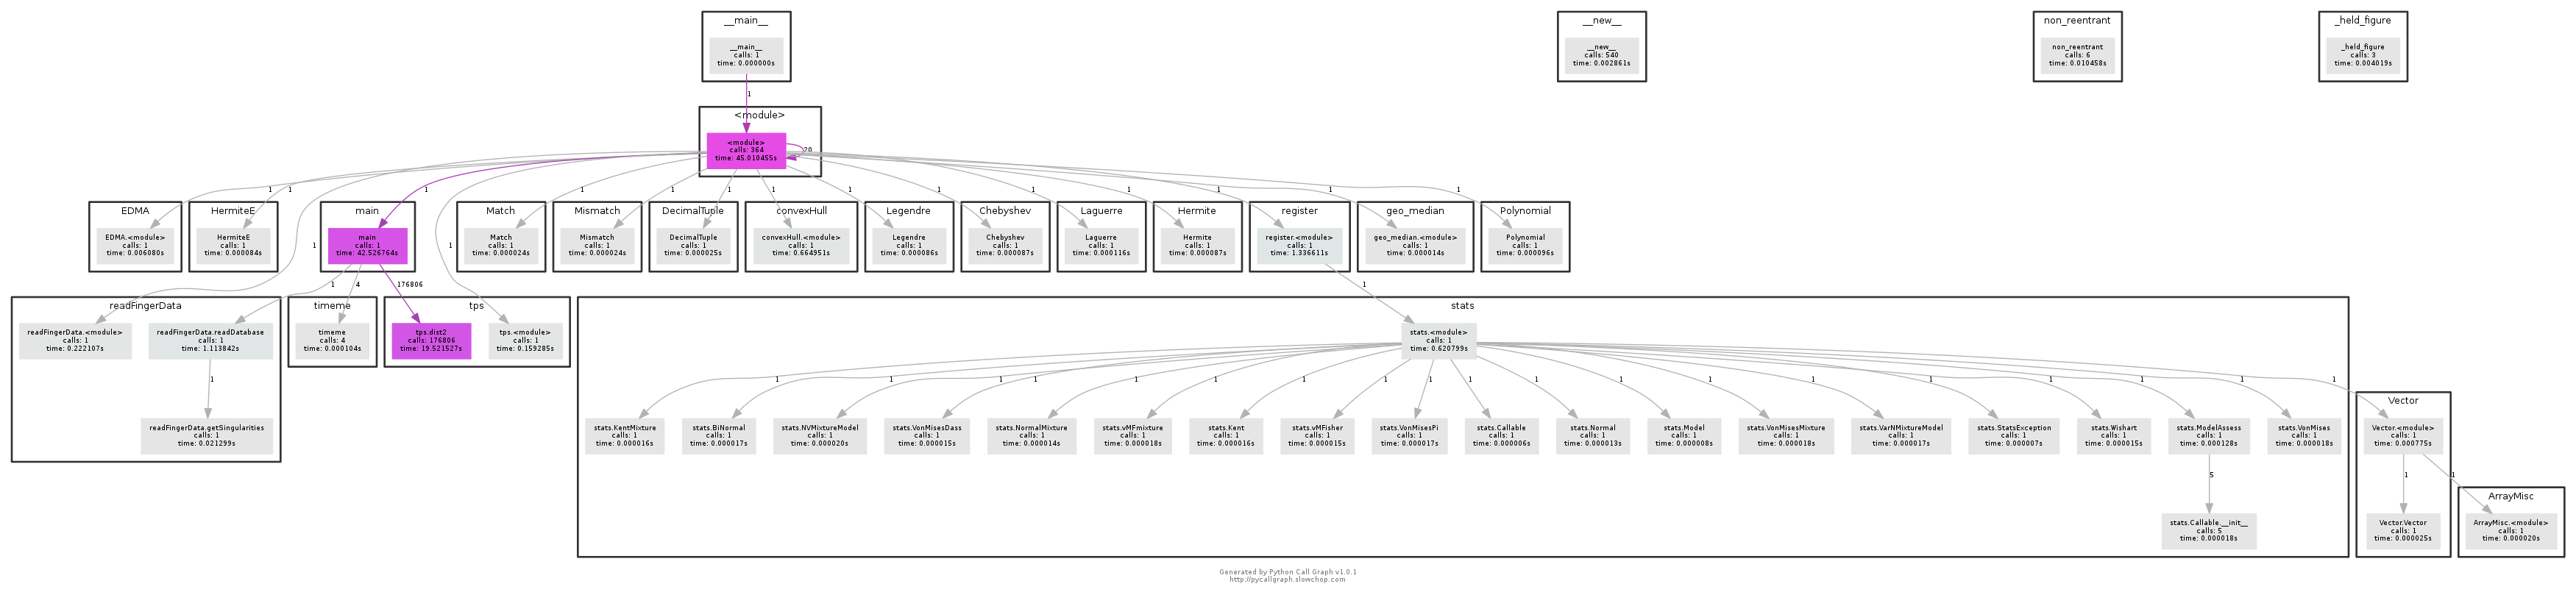
Using cProfile
If you want more detailed information on your programs performance then use cProfile. Using the cProfile module will output the raw profiling data to the screen, however we want it in a file so we use the “-o” option.
$ python -m cProfile -o profile.dat primes.py
This will create a binary data file profile.dat so you can’t just view the
data in there like a plain text file. You will need to write a short python
which uses the python module pstats to analyse the data. See the small example
program show_pstats.py.
$ ./show_pstats.py
The show_pstats.py program loads the binary data file and prints the data
that it contains sorted by time using just the two lines:
p = pstats.Stats('profile.dat')
p.sort_stats('time').print_stats(6)
Typical output would look like this:
Wed Aug 22 13:02:52 2018    profile.dat

   58541 function calls (57535 primitive calls) in 1.791 seconds

   Ordered by: internal time, cumulative time
   List reduced from 750 to 6 due to restriction <6>

   ncalls  tottime  percall  cumtime  percall filename:lineno(function)
    10000    1.712    0.000    1.712    0.000 primes.py:41(is_prime)
       86    0.009    0.000    0.009    0.000 {built-in method marshal.loads}
    105/1    0.007    0.000    1.791    1.791 {built-in method builtins.exec}
       15    0.006    0.000    0.006    0.000 {built-in method _imp.create_dynamic}
  301/299    0.005    0.000    0.013    0.000 {built-in method builtins.__build_class__}
        1    0.004    0.004    1.717    1.717 primes.py:62(main)
This shows that the function “is_prime” was called 10,000 times and took 1.712 seconds in total.
References
Documentation for the original Python Call Graph A more up-to-date fork of Python Call Graph is at pycallgraph2
The Python Profilers page covers using cProfile
Also read Python’s online documentation on Debugging and Profiling